
Monitoring cliff erosion with low-cost UAVs
Can drones be used to monitor erosion on cliff faces?
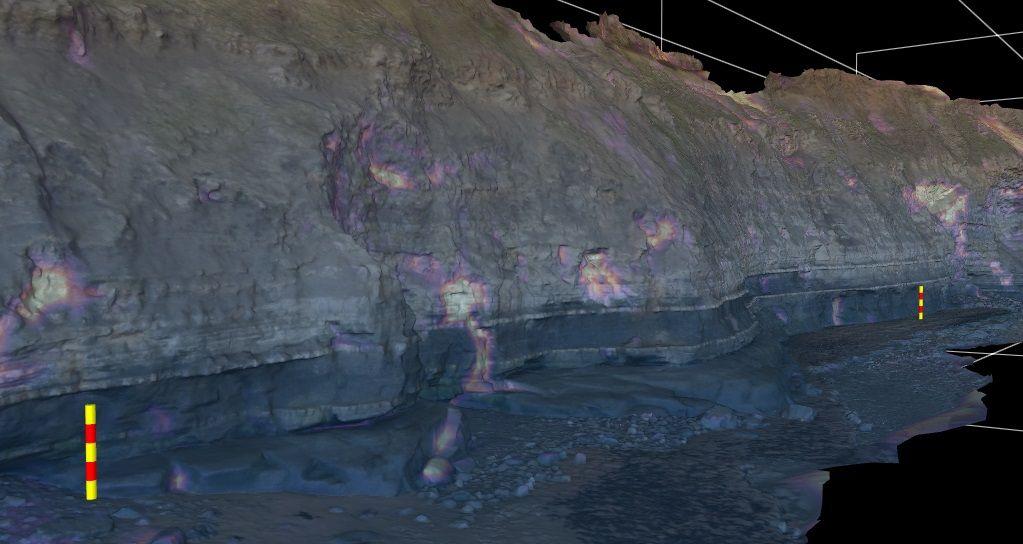
I recently had the opportunity to re-survey some of the cliffs around Staithes, NE England. I first surveyed a section of these cliffs in October 2017 using a Phantom 4. In October 2022 I revisited these exposures testing capabilities of the DJI Mini Pro 3. The original goal of this was to see how the data from the sub-250g Mini Pro 3 compared to data from the Phantom 4, but after processing the data it was clear this was a good chance to look at evidence for cliff erosion. Though conditions and hardware for data collection were different, variations in the cliff due to erosion are clearly visible.
There were several stages involved in the processing. The GPS data from the drones is not good enough to position the surveys for a meaningful comparison. The 2017 data was re-positioned using the environment agency DEM dataset. The 2022 data was then corrected using tie points to features visible in both datasets. The next stage used the ICP (iterative closest point) matching process in VRGS. The ICP algorithm minimises the error in position between the two datasets. Once matched I created a difference attribute using the cloud-to-cloud (C2C) distance to the closest point approach. The result reveals areas where there are significant differences between the two datasets.
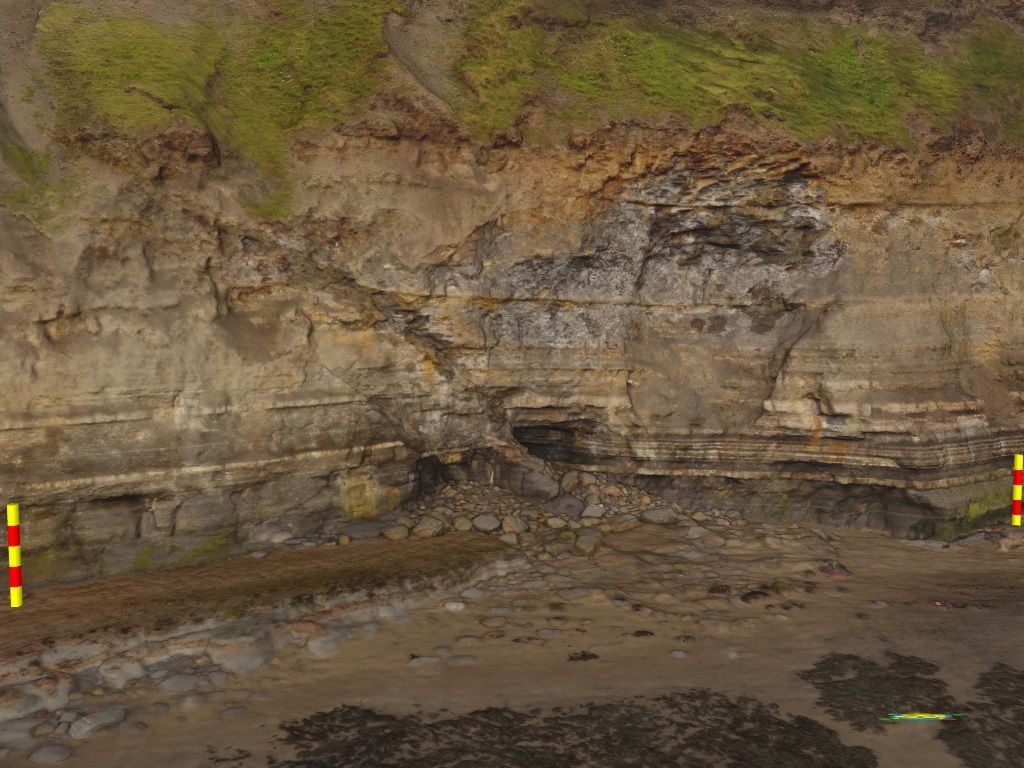
The image below shows the 2017 dataset, collected using a DJI Phantom 4 drone. This part of the cliff is prone to erosion and is more weathered compared to the surroundings. The source images are 4000x3000 pixels, and there were around 500 images in the survey. Both models have a point spacing of approximately 20cm.
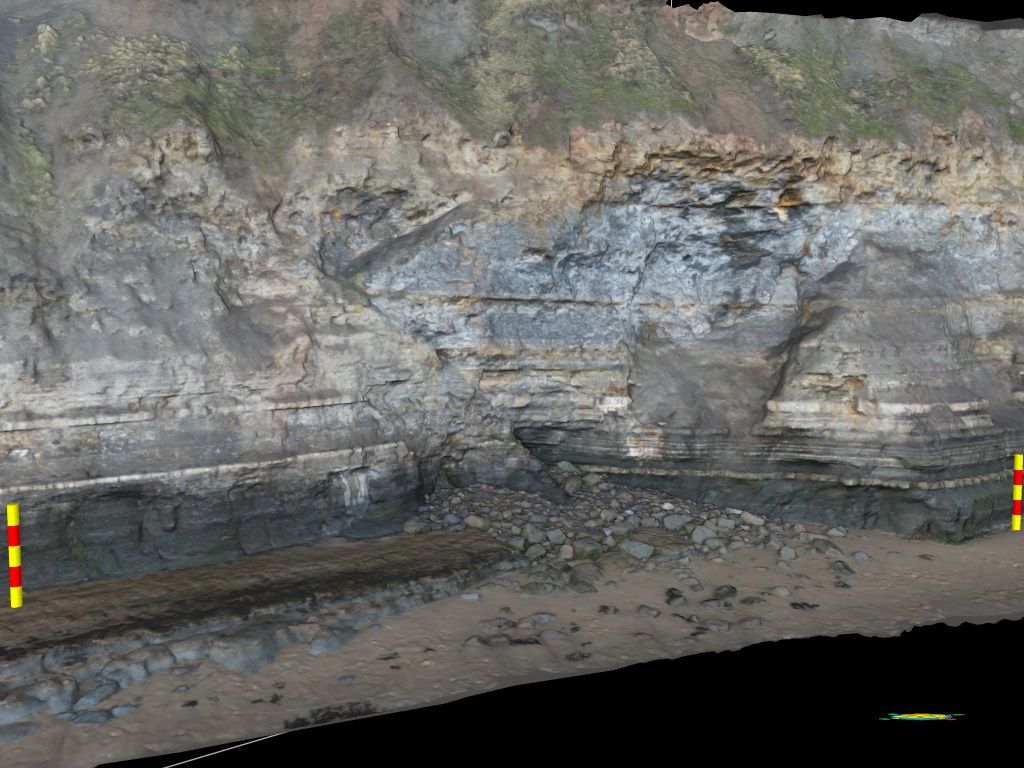
The next image shows part of the 2022 survey, completed using a DJI Mini Pro 3. The source images in this case are 4032x3024 pixels. The colour balance in these images is much better than in the original survey data. This may be due to incorrect settings in the 2017 survey, or improvements in camera software in the Mini Pro 3. I took less time collecting this data (due to the rising tide), with only 221 images over a larger study area.
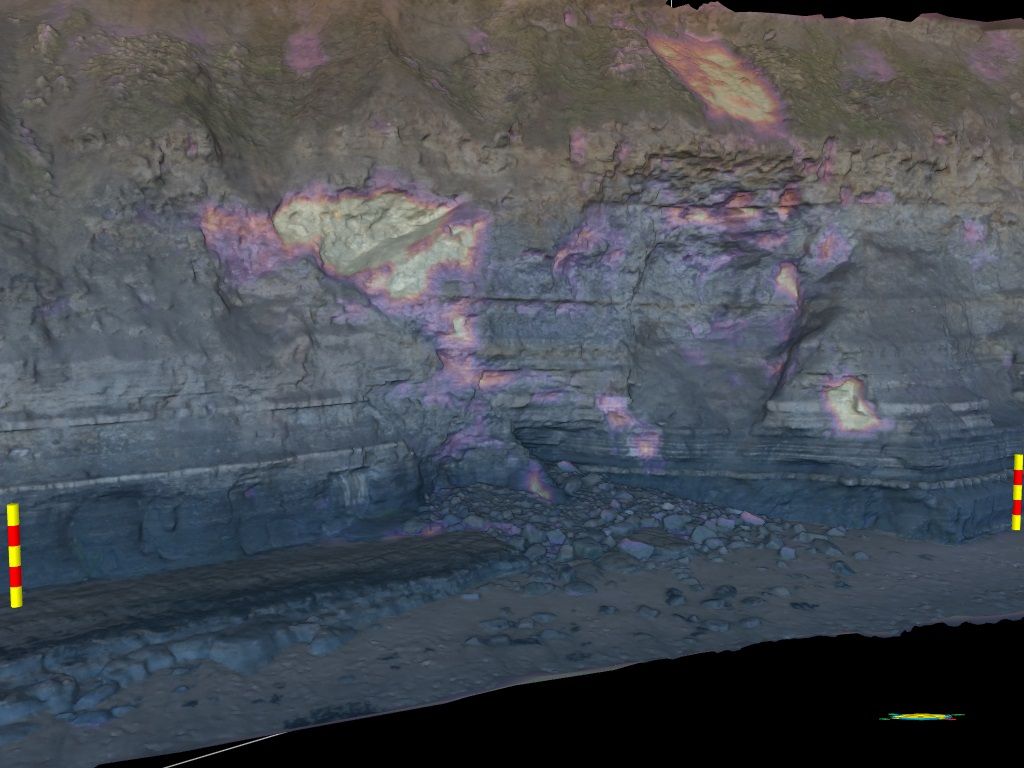
The next image shows the 2022 model blended with the difference attribute. This attribute is the distance to the nearest point in the 2017 model from each point in the 2022 model. The yellow areas show where the material has eroded away, with a difference of up to 2.5m. Visual inspection of the models in the highlighted areas confirms a topographic difference.
The focus of collecting this data was not to measure erosion, but to test the abilities of the DJI Mini Pro 3. Even with different drones and mission plans, I could quantify erosion along the cliff. I would have used similar flight plans in an ideal situation, but that was not possible here. It is easy to see a situation where you could make repeat flights at regular intervals to track erosion. The C2C approach to point cloud comparison also has its limitations, and the implementation of other algorithms, such as M3C2, is now underway in VRGS. Even in this simple case results are very useful. The power of repeat surveys to track erosion is evident, and you can get great results even with a basic setup.